Cause-and-effect operating models
See what actually drives your numbers.
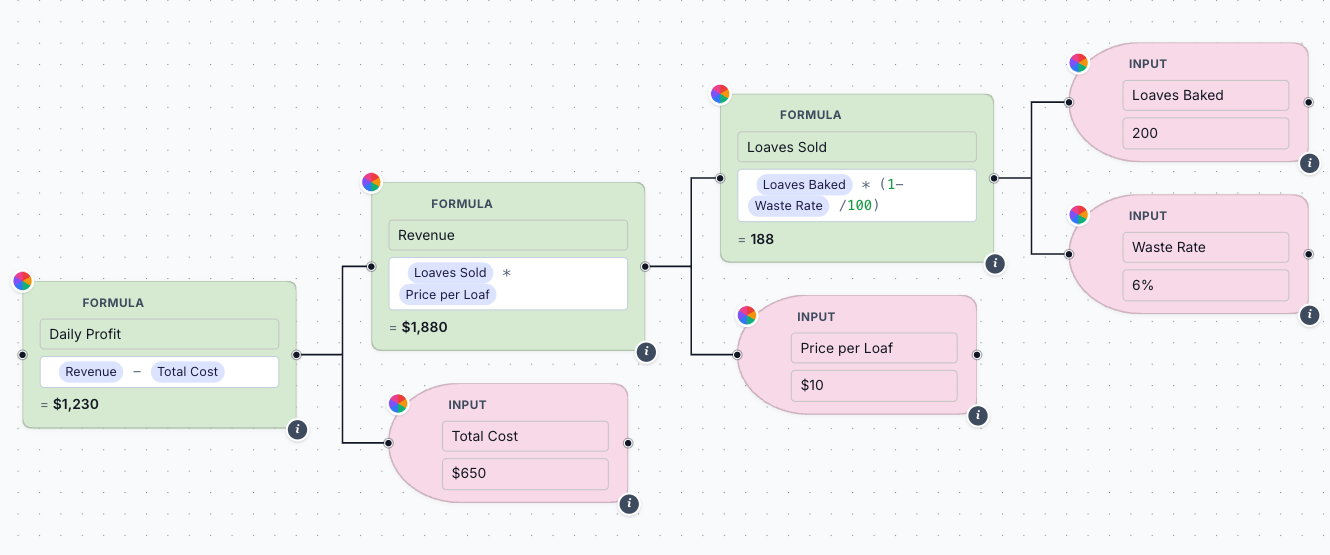
PIVVA is a visual way to map how a business works — what drives what, where the assumptions sit, and how everything connects. Change one number and every dependent value updates in front of you, all the way up the tree.
Built for people who diagnose businesses
Operators, consultants, CI and transformation leaders — anyone who has to explain cause and effect inside a business.
The logic stays visible
Decompose cost, margin, throughput, or quality into the drivers underneath. No logic buried in spreadsheet cells, no structure scattered across slides.
Change one number, see everything move
Live propagation through the whole tree. Test a lever and watch the impact reach the number your leadership cares about.
Scenarios you can defend
Fork your assumptions into scenarios and compare against Base side by side — which values moved, and why.
Now in invite-only Beta
30 Founding Members get lifetime free access to the core product — including every update to it.